Disclaimer: This is just for fun, my opinion and not investment advice. Do your due diligence, don’t do stupid things and don’t hold more USD than you can afford to lose.
Anyway, in the particular case of Bitcoin, I believe it is sound money, while fiat money is not. So if you think sound and uncensorable money is important to enough people, that could be a reason for the future returns being similar to the past ones, until a majority of the population realizes Bitcoin is better money.
Now that you’re here after that clickbaity headline, let’s play a little with some numbers.
Here I’m doing a simple Monte Carlo simulation on the daily returns of the USD bitcoin price to try to know what will be its most likely price by the end of 2018. You can see the whole code used to create this in my GitHub.
Daily returns? What’s that?
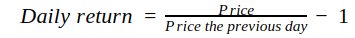
The return is a computation of how much a price has varied from one observation to the next one. In this case, as we’re taking daily data, the returns will be daily. And how are they calculated? There are several forms. Here, the simplest one will be enough:
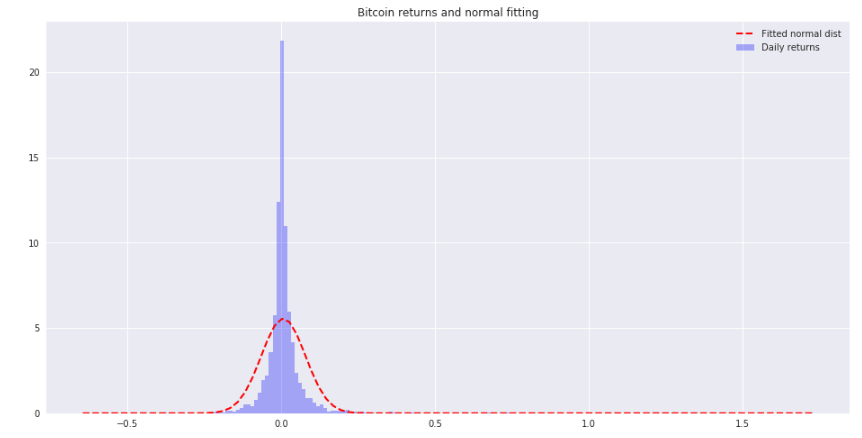
In an ideal world, the daily returns of financial assets would come from a normal distribution, but the reality far from that, and the actual daily returns have fatter tails. What does this mean? It means that extreme events have a higher probability of happening than a normal distribution would predict, and the distributions are not alike, as you can see below.
Ok, but what is a Monte Carlo simulation?
According to Wikipedia, Monte Carlo methods (or Monte Carlo experiments) are a broad class of computational algorithms that rely on repeated random sampling to obtain numerical results.
Basically, in a Monte Carlo simulation in finance we assume that the future behavior of the price of an asset will be similar to its past behavior, and we generate a lot of random versions of that future, called random walks, similar to the past. That’s done taking random samples from the past and stacking them together to build each one of those random walks.
A Monte Carlo simulation on the BTC/USD price during 2018
To build each of the random walks in our simulation, we’ll take random samples from the daily returns from 2010 to today, add one to each one of the samples and and multiply them cumulatively until Dec 31, 2018. Then we multiply the current price of bitcoin times the values of the random walk to get the simulated future prices. This will be done a lot of times (100,000 in this case) and at the end of the year we will see the distribution of final price for each random walk.
Random walks
The first 200 random walks look like this:
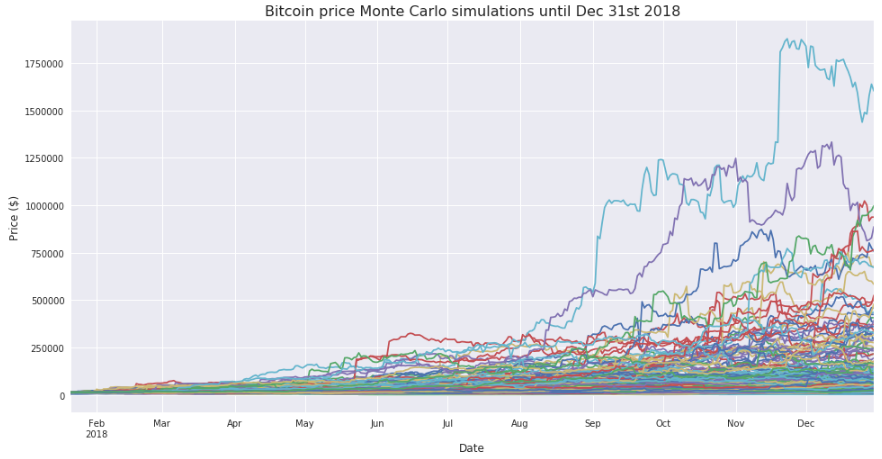
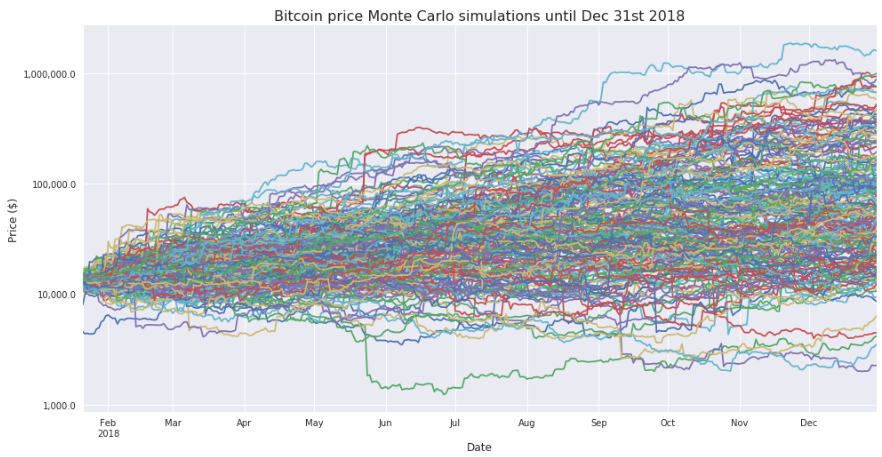
This upper plot tells us little information, as the exponential growth of some of the random walks made the y-scale of the plot big, while the majority of the random walks ended orders of magnitude below that blue random walk. Here, a logarithmic scale for the vertical axis would help us see what’s going on better:
Final price distributions
As we can see, the ending price for most of the random walks is between $10K and $100K. But only with the plot from above we can’t say much more than that. Now it’d be nice to see a histogram showing the distribution of the final prices for all of the 100,000 random walks we’ve generated before. This is it:
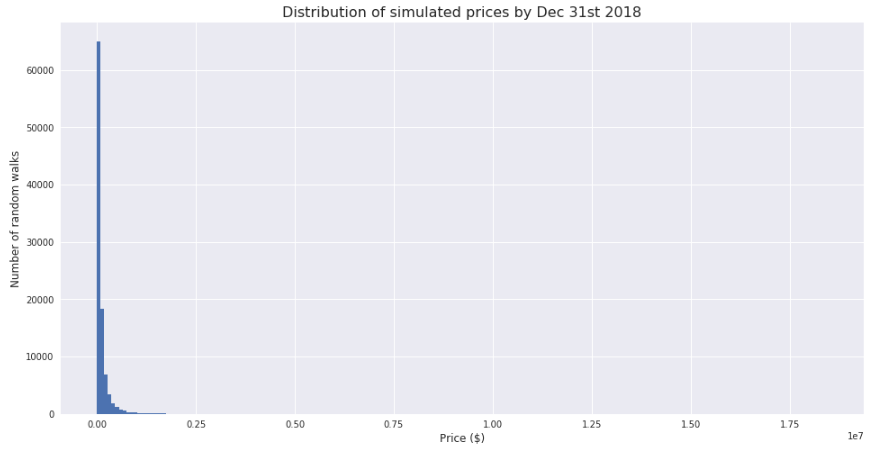
Again, we’re facing the same problem as before, and we can’t draw any kind of conclusions from that plot. The solution is the same: plotting the data using a logarithmic scale for the horizontal axis. This way, the plot looks much better:
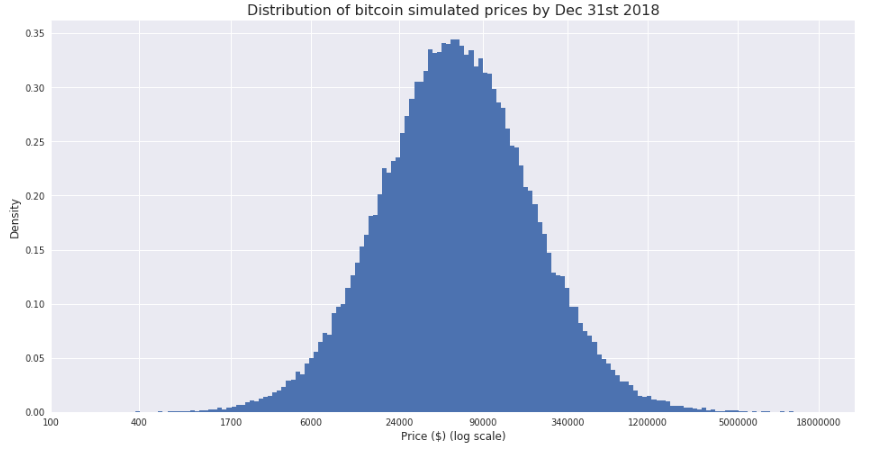
It looks like the most likely price is somewhere between $24K and $90K. To find that price more precisely, we could do several things. One of them is simply calculating the 50% percentile of the distribution of final prices: $ 58843. Another one is estimating the probability density function with Kernel Density Estimation and finding the price corresponding to the maximum of that function. The result of this is shown below:
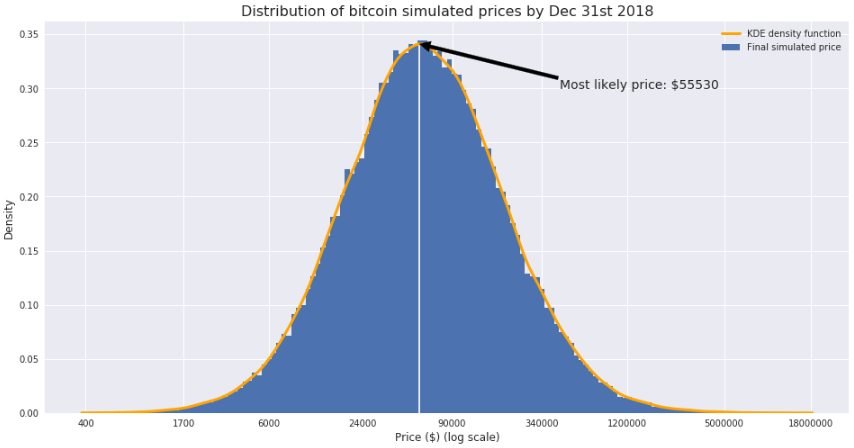
As you see, the estimations for the most likely price are similar, and both above $50K.
It’s important to note that this estimation doesn’t have to be taken to the letter and it’s better used as a way to find confidence intervals on where the future distribution where be. In this case an 80% confidence interval for the price of bitcoin would be between $13,200 and $271,277. Another way to look at this is that the chance that the price at the end of the year will be below 13,200 is the same as that of it being above $271,277 (if the price moves in the future similarly to how it did the past).
What else?
Now that we have the KDE density function, we could, for example, compute the probability that the price by the end of the year will be below a certain level.
In particular, if we want to calculate the probability that that price will be equal or lower than today’s (Jan 20th 2018), we’d just have to integrate the shadowed area in the following plot:
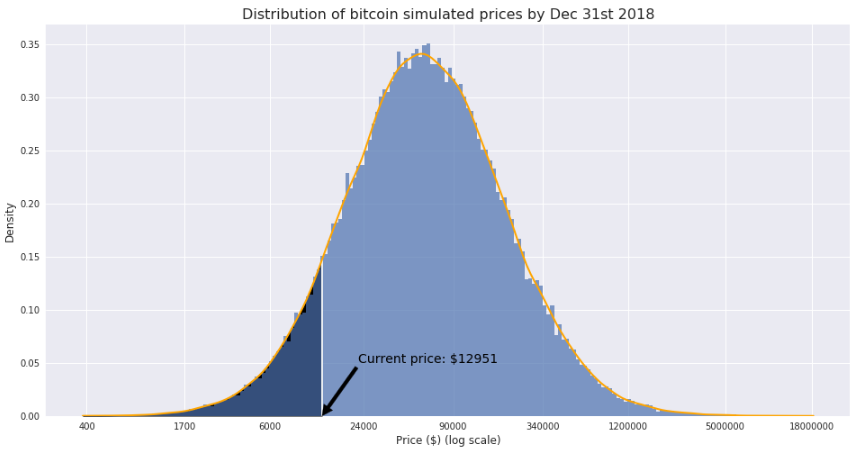
And what’s that probability? 9.84%.

Bonus tip
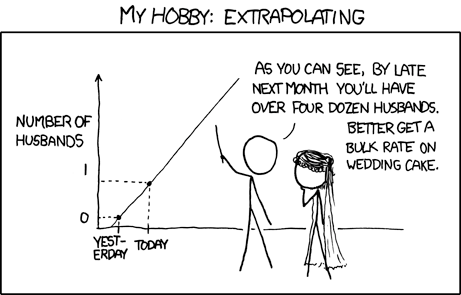
Yeah, I know. Nothing can keep going up forever, and the fact that it did in the past doesn’t mean it’ll do in the future. Below there’s a chart of another thingthat has also gone up a lot in the past.
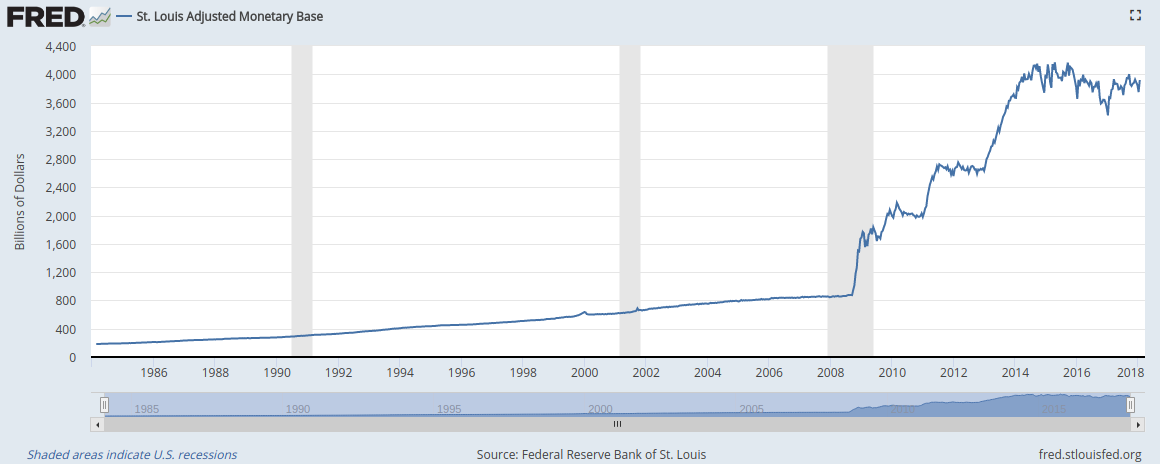
And you, do you believe the USA can keep printing money out of thin air forever?