There is no doubt that data is behind of any successful company.
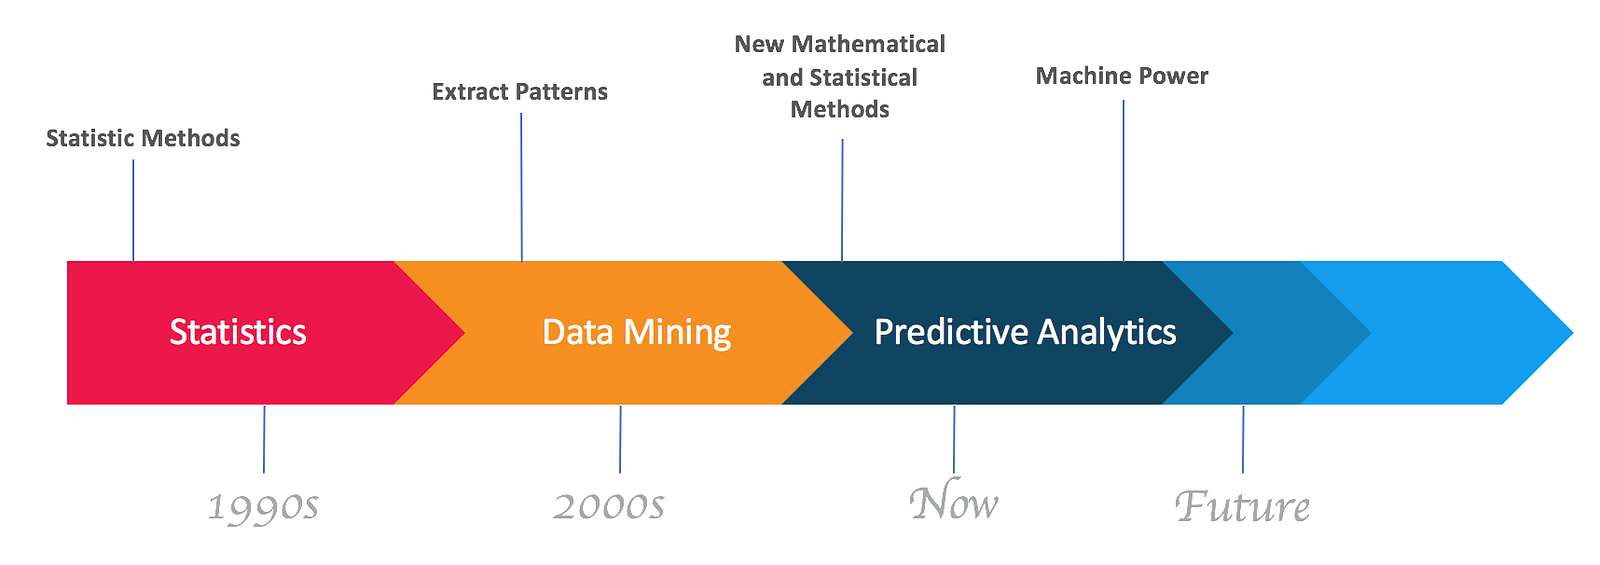
Data have been around for decades. Companies were getting benefits from these data by applying different “statistical methods”.
After some years, with the growth of data and the revolution of technology, companies started extracting patterns from data which lead to “data mining”.
Similarly, after few some years, due to new mathematical and statistical models, companies can now perform more accurate forecasts which lead to “predictive analytics”.

Get closer than ever to your customers. So close that you tell them what they need well before they realize it themselves. Steve Jobs.
Explosion of data
The arrival of internet, social media and the digitization of everything around the world have led to massive amount of data generated every second. For example:
- Retails databases, logistics, financial services, healthcare and other sectors.
- computers’ capabilities to extract meaningful information from still images, video and audio.
- Smart objects and Internet of Things.
- Social media, personnel files, location data and online activities.
- Machine generate data, computer and network logs.
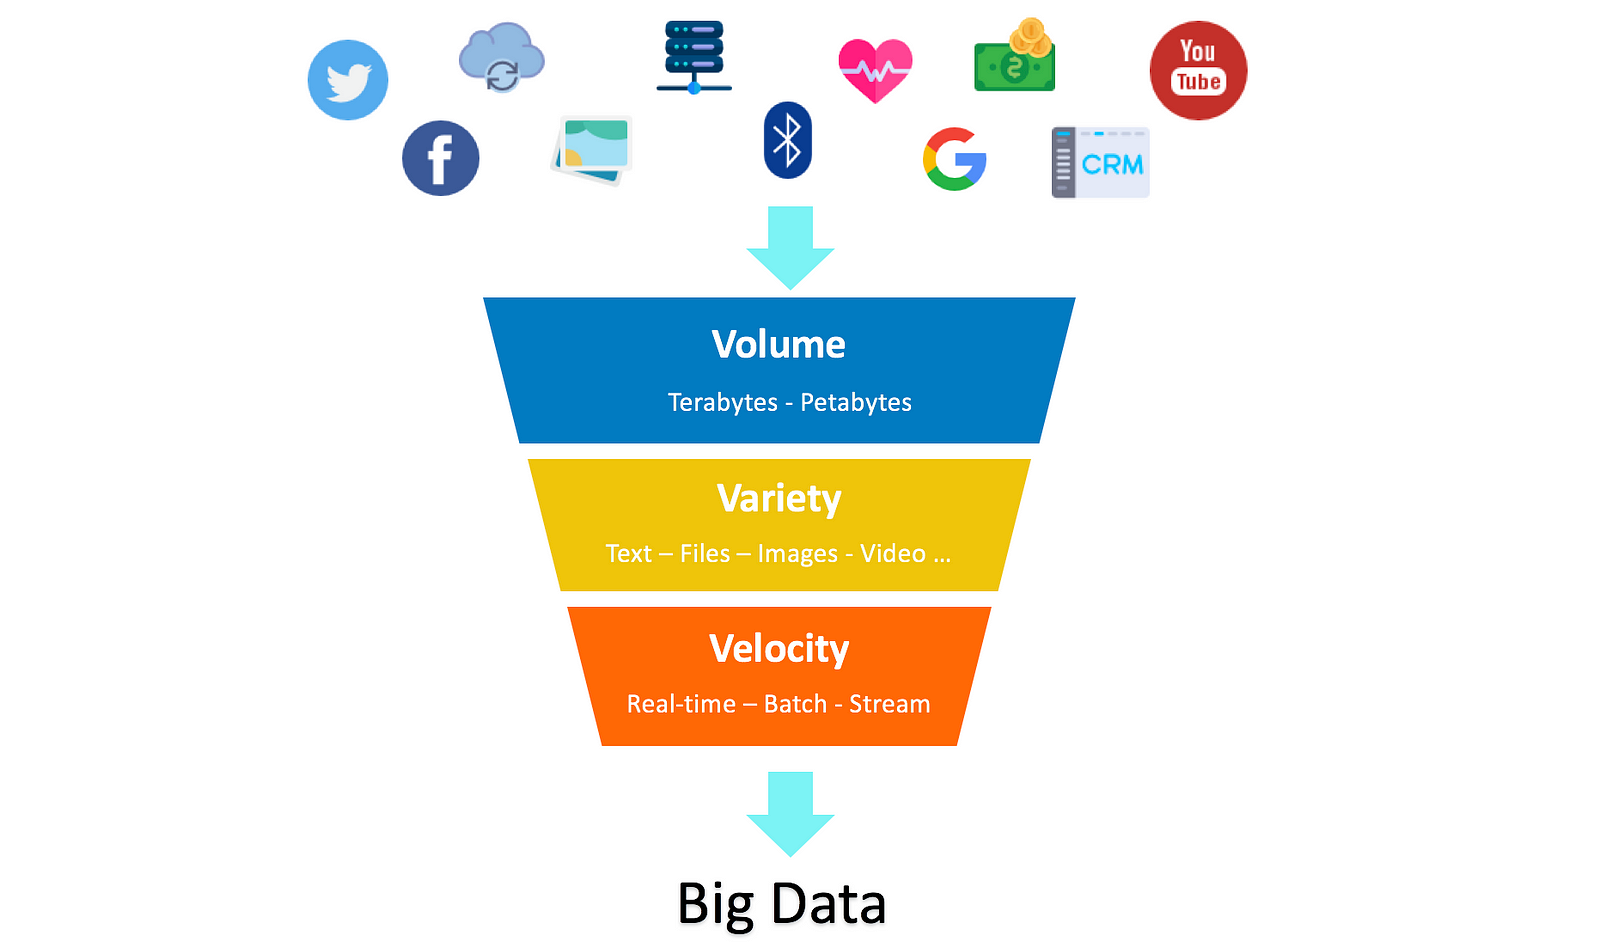
Accordingly, Big Data is defined by 3Vs (Volume, Variety and Velocity).
- Volume: amount of data (Terabytes, Petabytes or more)
- Variety: types of data (Text, Numbers, Files, Images, Video, Audio, machine data…)
- Velocity: speed of data processing (Real-time, Streaming, Batching, uncontrollable…)
The infographic below illustrates the 3Vs:

In God we trust. All others must bring data. William Edwards Deming
Additional Vs can be added to Big Data definition such veracity, variability, visualization and value.
- Veracity: trustworthiness of the data. For example outdated contact numbers are inaccurate and the business cannot rely on it.
- Variability: focuses on the correct meanings of row data that depends on its context. For example the word “Great” gives an positive idea, however “Greatly disappointed” gives negative impression.
- Visualization: refers to how the data is presented to business users (tables, graphical views, charts…)
- Value: unless turning data into value, it is become useless. Businesses expect significant value from investing in Big Data.
Big Data Challenges
Big data is so big and complex that traditional computer solutions, relational databases, data processing methods and traditional analytics are not scalable to deal with it.
Accordingly, for getting value from Big Data, organizations have to deal with Data Pipeline and Data Science.
The infographic below illustrates the process:

What is a Data Pipeline — ETL?
At the beginning of any analytics, data-driven decision require well-organizedand relevant data stored in a digital format. To get there, Data Pipeline is needed.
A Data Pipeline, also known as ETL (Extract — Tranform — Load), is a set of automated sequential actions to extract data from “different sources” and load it into a “target databases or warehouse”. During this process, data needs to be shaped or cleaned before loading it into its final destination.

Extract, Transform and Load (ETL) is considered the most underestimated and time-consuming process in data warehousing development. Often 80% of development time is spent on ETL. J. Gamper, Free University of Bolzano
ETL process involves the following actions:
- Extract: Connecting to various data sources, selecting and collecting the necessary data for further processing.
- Transform: Applying various business rules and operations such as filtering, cleaning, sorting, aggregating, masking, validation, formatting, standardizing, enrichment and more.
- Load: Importing the extracted and transformed data into warehouse or any target database.
What is Data Store?
After Extract Transform Load process, data will be stored into a ready-to-consume format for analytics. But due to the variety, volume and value of data, different technologies and methods should be considered.
Accordingly, a Data Store is a repository for persistently storing and managing collections of data which include not just repositories like databases, but also simpler store types such as simple files, emails etc. Wikipedia
Data store may be classified as:
Warehouse: is a technology that aggregates structured data from one or more sources so that it can be compared and analyzed to provide greater executive insight into corporate performance. #structuted #relational #performance #scalable
Data Lake: is a centralized storage repository that holds a vast amount structured and unstructured data at any scale. Data can be stored data as-is, without having to first structure the data, and run different types of historical and real-time analytics
MDM “Master Data Management”: is a comprehensive method to link all critical data to a common point of reference. It’s a pillar to improve data quality.
For example, suppose a customer is presented in many systems within the organization, but his name, address might not be same in all the systems. For this reason we need methods for cleansing the data, match the data and then create a unique Master version of the existing data.
Extract Business Value
Big Data Analytics is a combination of scientific methods, processes, algorithms and systems required to extract business value, knowledge, insights, intelligence, analytics and predictions from data.

Data Analytics covers different areas and goals such:
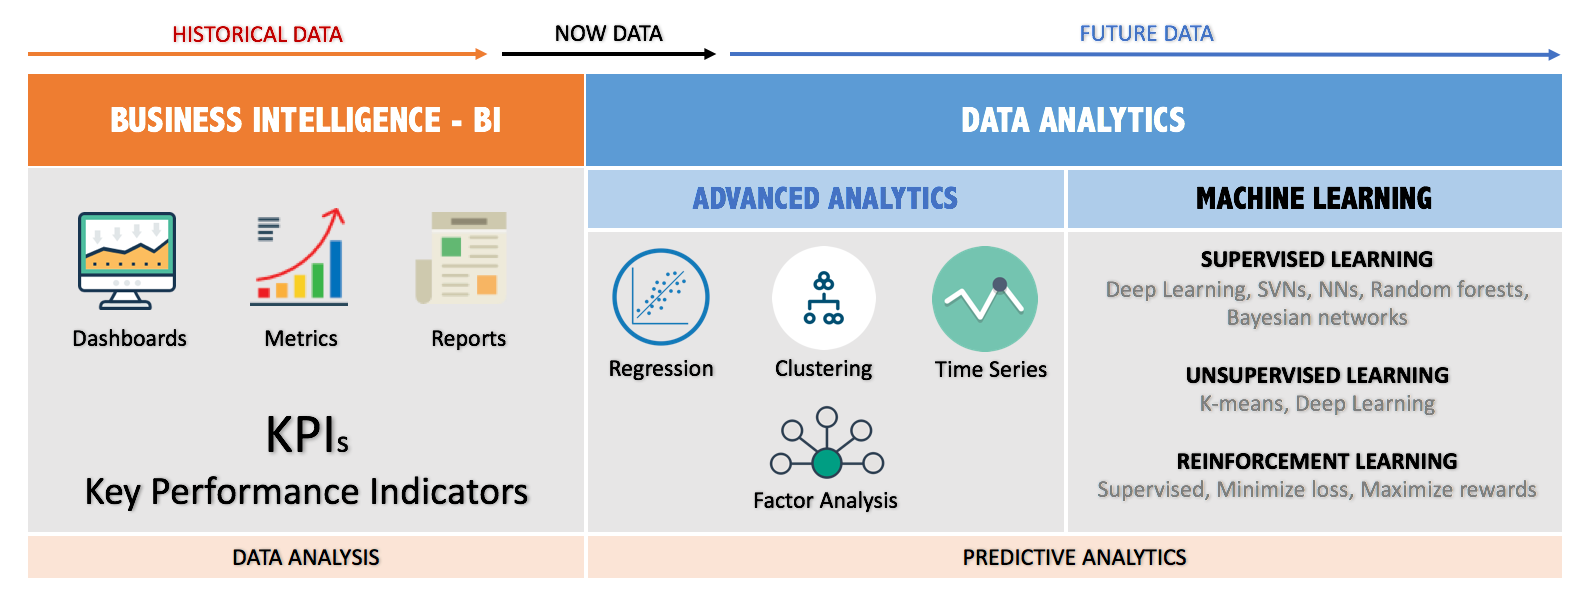
Business Intelligence — BI: is a combination of technologies and methods that use current and historical data to support strategic and tactical data-driven business decisions. The analyzed data will be presented in the format of metrics, KPIs, reports and dashboards.
Advanced Analytics: works beyond of traditional business intelligence (BI), to discover deeper insights, make predictions and forecasting “Predictive Analytics”. Also it enables businesses to conduct what-if analyses to predict the effects of potential changes in business strategies. It includes different techniques such:
- Data mining, pattern matching and forecasting
- Semantic, sentiment, network, cluster, graph and regression analysis
- Multivariate statistics, simulation, complex event processing and neural networks
Machine Learning — ML: is creating an algorithm, which can be used by computers to find a model that fits the data as best as possible, and makes very accurate predictions based on that.
The concept is build a “Model” by implementing algorithms to train the “Machine Learning” using data. Accordingly, the ML tries to categorize data based on its hidden structure. Roughly, training algorithm can fall into three categories Supervised, Unsupervised and Reinforcement.
About the Author
This submitted article was written by Peter Jaber, a solutions Architect with over 20 years of experience. Contact.


